agriculture
Type of resources
Available actions
Provided by
Years
Formats
Representation types
Update frequencies
status
Resolution
-

Cette carte est issue de travaux de recherche menés dans le cadre du projet GABIR (Gestion Agricole des Biomasses à l’échelle de l’Ile de la Réunion). Elle a été produite en utilisant une mosaïque d'images Spot6/7 pour calculer la segmentation (extraction d'objets homogènes à partir de l'image). Nous utilisons une base de données terrain ayant une nomenclature emboitée avec 3 niveaux de précision nous permettant de produire une classification par niveau. Le niveau 3, le plus détaillé distinguant les types de cultures présente une précision globale de 86% et un indice de Kappa est de 0,85. Le niveau 2, distinguant les groupes de cultures présente une précision globale de 91% et un indice de Kappa est de 0,90. Le niveau 1, distinguant les grands groupes d'occupation du sol présente une précision globale de 97% et un indice de Kappa est de 0,95. (2019-06-12) La précision globale de la carte est de 88,71 % et l'indice de Kappa est de 86,47%. La chaine Moringa est mise au point au sein du CES Occupation des Sols du pôle THEIA pour cartographier l’occupation du sol dans les contextes variés des pays du Sud. Afin d’être plus facilement reproductible, elle est automatisée et son implémentation est réalisée avec des outils libres (Orfeo Toolbox, R, Python). (2019-03-26)
-

Implanting new plots of mass-flowering resources in landscapes can have both positive and negative effects on pollinator visitation rates to crops. We investigated the effects of flowering plot characteristics on the best places to locate new co-flowering plots to optimise crop pollination. First,we parameterised and validated an existing pollination model with field data. Then,we ran two simulation experiments,both of which simulated the conversion of one or multiple plots by modifying their flowering and nesting resource attributes. We quantified changes in pollinator visitation rates to "target" sunflower fields according to different conversion scenarios.The data set is composed of (i) the validation of the spatially explicit InVEST pollination model using field data collected in the Vallées et Coteaux de Gascogne (France),and (ii) the results associated with the two simulation experiments using InVEST pollination model. For the validation of model parameters,we sampled bees in 30 sites with three coloured pan traps per sampling site. We compared the predicted visitation rates vs the observed total abundance of bees in the pan traps. The visitation rate predictions were calculated in different radii around the sampling sites (from 1 to 100 m in increments of 1 m). The first experiment simulated the conversion of the flowering and nesting attributes of 1800 plots according to four scenarios (wildflower plot,sunflower field,More flowers,More nests). Changes in visitation rates induced by plot conversion were assessed in 368 target sunflower fields and then analysed according to the distance separating the converted plots from the target sunflower fields. For statistical replication,we divided our study area into 15 circular sectors. The radius of the circular sectors was 5 km and the sectors were centered on the centroid of a target sunflower field. The second simulation experiment quantified changes in visitation rates caused by the conversion of multiple plots into sunflower fields which are isolated to greater (Isolation scenario) or less extents (Aggregation scenario). The target sunflower fields used to assess changes in visitation rates were the 15 sunflower fields defining the centre of the 15 circular sectors and the converted sunflower fields.
-

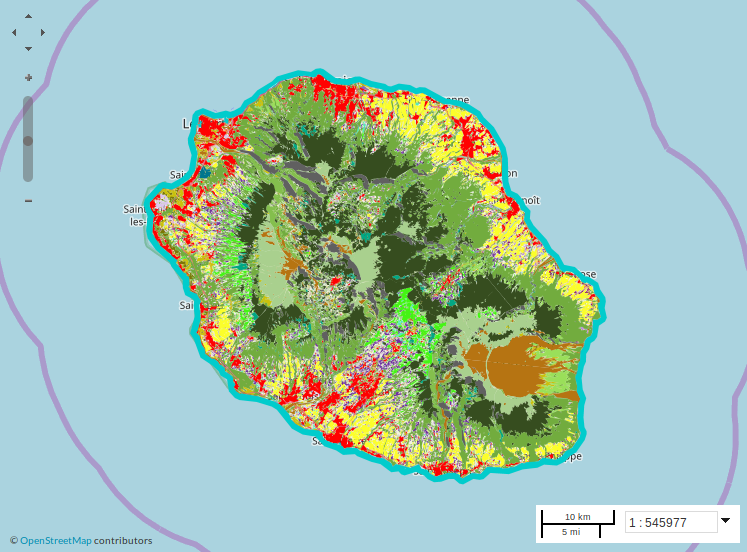
Cette carte d'occupation du sol a été obtenue avec la chaîne Moringa mise au point par l’équipe Cirad de l’UMR TETIS. Il s’agit du résultat d’une classification supervisée combinant une mosaïque d’images Spot6/7 acquises en 2021, d’indices de textures calculés à partir de cette image Spot6/7 et de la sérietemporelle des 63 images Sentinel-2 de 2021 . Cette carte a été réalisée avec une base de données d’apprentissage actualisée en 2021. La carte présentée s'appuie sur le 3ème niveau (le plus détaillé), les données attributaires contiennent les niveaux 1 et 2. Les fichiers de style de ces niveaux sont associés à cette carte.
-

Ce jeu de données concerne les cartes produites, pour l'année 2019, en utilisant une mosaïque d'images Spot6/7 pour calculer la segmentation (extraction d'objets homogènes à partir de l'image). Nous utilisons une base de données terrain ayant une nomenclature emboitée avec 3 niveaux de précision nous permettant de produire une classification par niveau. Le niveau le plus détaillé distinguant les types de cultures présente une précision globale de 88% et un indice de Kappa est de 0,86. Le niveau 2, distinguant les groupes de cultures présente une précision globale de 92% et un indice de Kappa est de 0,93. Le niveau 1, distinguant les grands groupes d'occupation du sol présente une précision globale de 97% et un indice de Kappa est de 0,95. Une fiche détaillée présentant la méthode et les résultats de validation est téléchargeable (2020-04-30)
-

A very high spatial resolution Land Use and Land Cover map was produced for the greater Marino watershed (Peru) using the MORINGA processing chain. The methods involved multisource satellite imagery and a random forest model, as well as manual post-treatment. The final map provides important information for environmental management and monitoring and contributes to developing standardized methodologies for accurate LULC mapping. Classification 2019 – Level 2
-

A very high spatial resolution Land Use and Land Cover map was produced for the greater Marino watershed (Peru) using the MORINGA processing chain. The methods involved multisource satellite imagery and a random forest model, as well as manual post-treatment. The final map provides important information for environmental management and monitoring and contributes to developing standardized methodologies for accurate LULC mapping. Training Dataset
-

A very high spatial resolution Land Use and Land Cover map was produced for the greater Marino watershed (Peru) using the MORINGA processing chain. The methods involved multisource satellite imagery and a random forest model, as well as manual post-treatment. The final map provides important information for environmental management and monitoring and contributes to developing standardized methodologies for accurate LULC mapping. Classification 2019 – Level 1
-

A very high spatial resolution Land Use and Land Cover map was produced for the greater Marino watershed (Peru) using the MORINGA processing chain. The methods involved multisource satellite imagery and a random forest model, as well as manual post-treatment. The final map provides important information for environmental management and monitoring and contributes to developing standardized methodologies for accurate LULC mapping. 3 levels are available with the training dataset
-

A very high spatial resolution Land Use and Land Cover map was produced for the greater Marino watershed (Peru) using the MORINGA processing chain. The methods involved multisource satellite imagery and a random forest model, as well as manual post-treatment. The final map provides important information for environmental management and monitoring and contributes to developing standardized methodologies for accurate LULC mapping. Classification 2019 – Level 3
-

Description de la nature du couvert végétal par campagne agricole depuis 2008/2009 jusqu'à 2020/2021 sur chacune des parcelles de la ferme expérimentale INRAe de Saint Laurent de la Prée (17).
 Geocatalogue Dynafor